

Introduction
Organizations attempt to extract useful insights from enormous amounts of data in today's data-driven society. A potent tool like Grafana can completely revolutionise how data is monitored and analyzed.
Grafana is an open-source platform for data visualization and monitoring that enables users to build interactive dashboards, carry out in-the-moment data analysis, and discover useful information. The main characteristics, advantages, and use cases of Grafana will be examined here, throwing light on how it enables organizations to maximize the potential of their data.
What is Grafana?
Grafana is a feature-rich platform that creates visually captivating dashboards by combining data from many sources, such as databases, cloud services, and monitoring systems. Numerous data sources are supported, including Graphite, Prometheus, Elasticsearch, MySQL, and others. Grafana makes data visualization and monitoring easier with its simple interface and wide range of plugins.
Key Features of Grafana
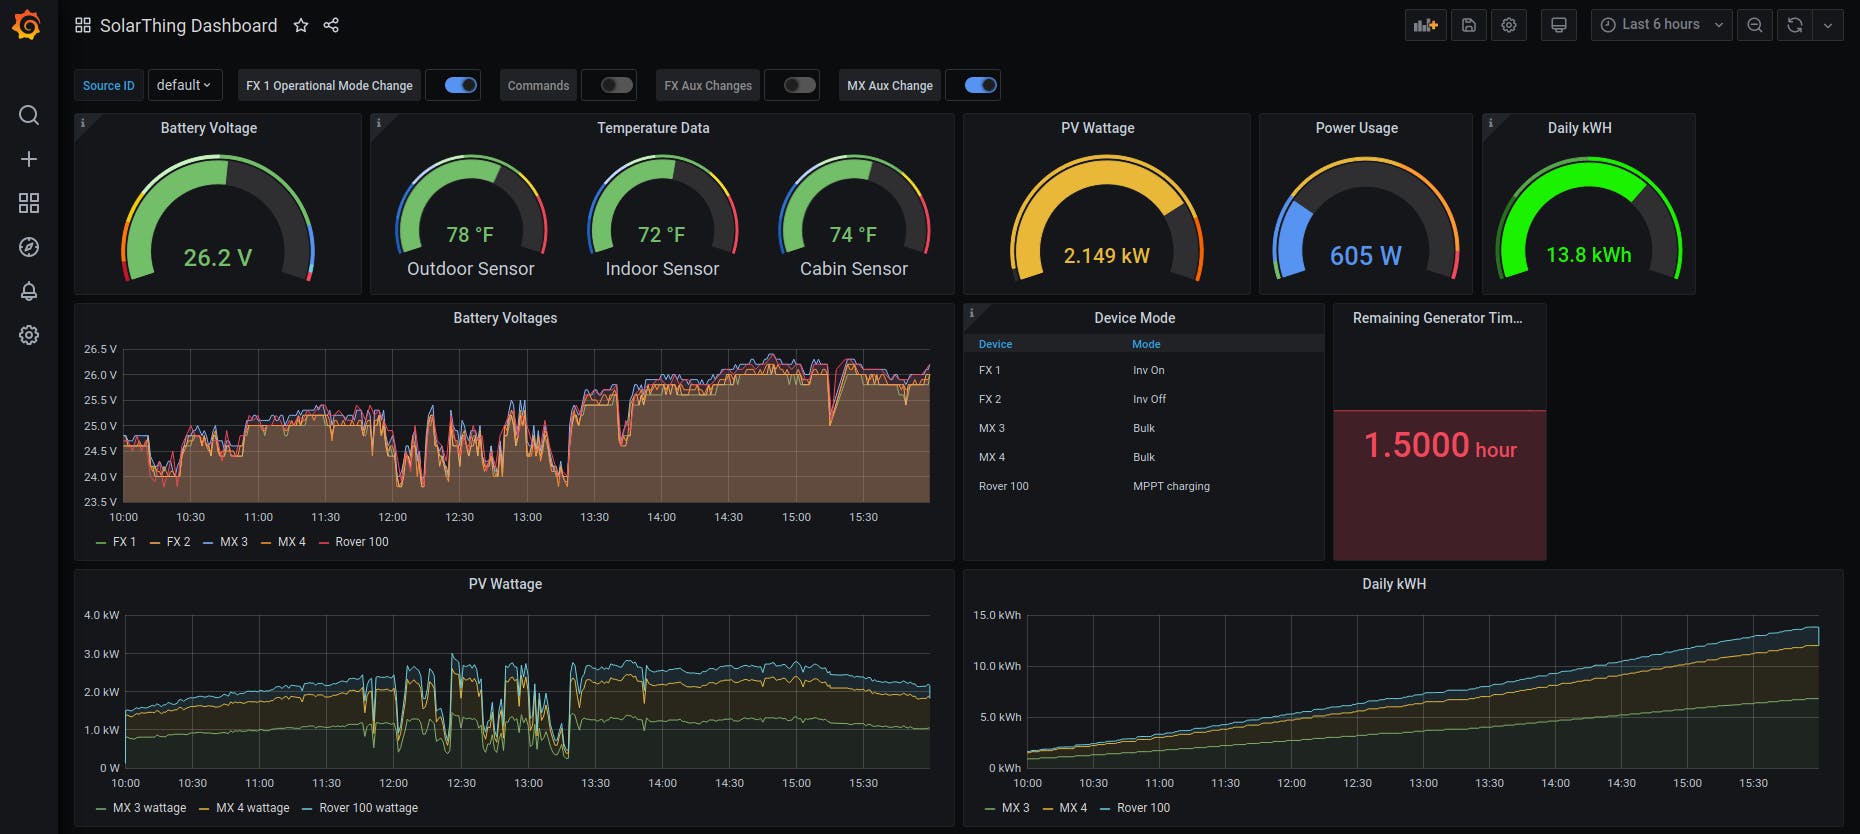
Interactive Dashboards - Grafana enables the construction of aesthetically appealing and interactive data visualizations by allowing users to customize dashboards with drag-and-drop capability.
Data Source Integration - It facilitates the connection and visualization of data from several systems in a single dashboard by supporting a wide range of data sources.
Alerting and Notifications - Grafana offers strong alerting features that let users configure alerts based on specific data criteria and receive messages via a variety of channels, including email, Slack, PagerDuty, etc.
Annotations and Templating - Using Templating in Grafana, users may create dynamic dashboards by switching between various variables and filters. Data anomalies or specific events are highlighted via annotations.
Extensive Community Support
Grafana's plugin ecosystem provides a large selection of plugins created by the community, enabling users to expand its functionality and effortlessly interact with other systems.
Benefits of Using Grafana
Data visualization - With the help of Grafana, users can produce amazing visualizations that make difficult-to-understand data more approachable and encourage the use of data to drive decisions.
Real-time monitoring - Grafana enables proactive problem-solving, performance optimization, and incident response by allowing you to keep an eye on your data and systems in real time.
Cross-Platform Compatibility - Grafana is cross-platform compatible and may be used with a variety of operating systems, including Windows, Linux, and macOS. Additionally, it is native to the cloud and can be easily incorporated into cloud systems.
Collaboration Workflows: Grafana offers group collaboration, enabling users to share insights and work together to troubleshoot issues as well as create dashboards.
IT Operations and Infrastructure Monitoring
Grafana is frequently employed to measure resource utilisation, visualise network performance, monitor system metrics, and analyse log data to facilitate effective IT operations and infrastructure management.
DevOps and Application Monitoring
Grafana have the ability to connect with well-known monitoring tools like Prometheus and InfluxDB, Helping DevOps teams to learn more about the application performance, container orchestration, and microservice architecture.
Internet of Things (IoT) Monitoring
Grafana is a great option for monitoring IoT devices, visualizing sensor data, and examining trends for preventative maintenance and anomaly detection because it has a feature to handle time-series data.
Conclusion
Grafana is a flexible and strong platform for data visualization and monitoring that helps businesses realize the full potential of their data. Grafana enables businesses to make data-driven choices, optimize performance, and improve overall operational efficiency by offering interactive dashboards, real-time monitoring, and seamless interaction with diverse data sources. Grafana provides the tools and capabilities to transform unprocessed data into usable insights, regardless of whether you are an IT specialist, a data analyst, or a business stakeholder, This data processing tool helps you out in any field.